Healthcare Fraud Detection
- Suphanet Kotchum
- Feb 2, 2022
- 7 min read


The US has lost $700 billion dollars due to fraud in the healthcare system for unlawful personal gains. For example, physicians could prescribed more medicine/expensive medicines than needed. Also, there are many players involved in the healthcare fraud system that are: healthcare providers, patients, state Medicaid agency/Insurer, Federal.
Therefore, the ability to detect healthcare fraud would help reduce unnecessary cost to the healthcare system.
Section 1: Data Preparation
Section 1.1: Install Required Libraries and Load Data


Check duplicate rows: There is no duplicate row


Section 1.2: Data Cleaning


Section 2: Exploratory Data Analysis
Section 2.1.1: Overall Data Exploratory
Average_Total_Payments
Average_Covered_Charges
Average_Covered_Charges

Section 2.1.2: Average Total Payments


Section 2.1.2: Average Total Payments
Average Total Payments = Total Payments / Total Discharges. The average and the median total payment is around 9,700 and $7,200 consecutively. The data is right skewed.


Section 2.1.3: Total Discharges
Total discharges: The number of discharges billed by the provider for inpatient hospital services. When you leave a hospital after treatment, you go through a process called hospital discharge. The average and median total discharge are 42 and 27 consecutively. The data is right skewed


Section 2.2: Count by State
Healthcare Providers
The top 5 states with the highest healthcare providers are CA, TX, FL, NY, and IL consecutively.
The top 5 states with the least healthcare providers are ND, DEE, VT, WY, and AK consecutively.


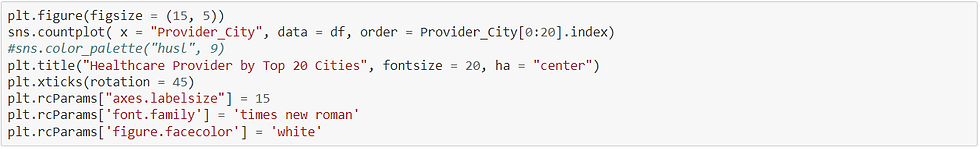
Section 2.3: Count by Top 20 Cities
Healthcare Providers
The top 5 cities with the highest healthcare providers are Chicago Baltimore, Houston, Philadelphia, and Brooklyn consecutively.

Section 2.4: Top 20 Healthcare Providers
Healthcare Providers
The top 5 healthcare Providers are:
GOOD SAMARITAN HOSPITAL
ST JOSEPH MEDICAL CENTER
MERCY MEDICAL CENTER
MERCY HOSPITAL
ST MARY MEDICAL CENTER consecutively.

Section 2.5: Top 20 Prescription Drugs
Prescription Drugs
The top 5 Prescription Drugs are:
194 - SIMPLE PNEUMONIA & PLEURISY W CC
690 - KIDNEY & URINARY TRACT INFECTIONS W/O MCC
292 - HEART FAILURE & SHOCK W CC
392 - ESOPHAGITIS, GASTROENT & MISC DIGEST DISORDERS W/O MCC
641 - MISC DISORDERS OF NUTRITION,METABOLISM,FLUIDS/ELECTROLYTES W/O MCC


Section 3: Feature Engineering
Feature engineering steps below are meant to find outliers/anomalous information about the healthcare fraud. There are several features provided. However, outliers/anomalous activities do not infer that those transactions are fraud. However, they are infer that there are possibilities to be out of normal range by the same activities. As a data analysis, we have to dive down into reason behind the data why the numbers are off before making any conclusions.
The benchmark group by drug is to help data analysis compare the average/median payment for each drug type treatment. While the total discharge shows the number of inpatient in each hospital with different health issues(look at the drug description to see which health issues were treated).
The group by state and drug is to compare the drug and total discharge within the same state.
Moreover, the group by state, city, and drug is analyzed in more granular level. This shows the cost/total discharge with in the same city. Because data analysis should not conclude that if the cost of treatment in New York City is more than that of Alaska, it means that the treatment in New York City derived from fraud activities. Therefore, this benchmark is created.
Section 3.1: Create Benchmark Tables
Benchmark 1: Group by Drug (Nationwide)
Dive down into drug description level


Benchmark 2: Group by State, Drug
Dive down into state level


Benchmark 3: Group by State, City, Drug
Dive down into city level


Merge the tables


Section 3.2: Feature Engineering
Feature 1 - 4: Group by Drug
Group by Drug detecting anomalous activities by drug level.
Feature 1: Average Total Payment Group by Drug
Find the Outliers : Potential anomalous healthcare providers
This data shows average the total payment by drug type. The outlier cutoff for this is choses at 95th percentile, which is 1.48X the average payments, meaning that there are 5 transactions from every 100 transactions that have potential to deviate from normal activity transactions. Therefore, there are 8114 suspicious transactions from 629 healthcare providers as display below.


Plot the outliers

Feature 2: Median Total Payment Group by Drug
Find the Outliers : Potential anomalous healthcare providers
This data shows the median average total payment by drug type. The outlier cutoff for this is choses at 95th percentile, which is 1.6X the average payments, meaning that there are 5 transactions from every 100 transactions that have potential to deviate from normal activity transactions. Therefore, there are 8005 suspicious transactions from 619 healthcare providers as display below.


Feature 3: Average Total Discharge Group by Drug
Find the Outliers : Potential anomalous healthcare providers
This data shows the average total discharge by drug type. The outlier cutoff for this is choses at 95th percentile, which is 2.4X the average discharge, meaning that there are 5 transactions from every 100 transactions that have potential to deviate from normal activity transactions. Therefore, there are 8160 suspicious transactions from 970 healthcare providers as display below.


Plot The Outlier

Feature 4: Median Total Discharge Group by Drug
Find the Outliers : Potential anomalous healthcare providers
This data shows the median total discharge by drug type. The outlier cutoff for this is choses at 95th percentile, which is 3.12X the median discharge, meaning that there are 5 transactions from every 100 transactions that have potential to deviate from normal activity transactions. Therefore, there are 8160 suspicious transactions from 1040 healthcare providers as display below.


Plot The Outlier

Feature 5 - 8 :By State and Drug
Feature 5: Average Total Payment Group by State and Drug
Find the Outliers : Potential anomalous healthcare providers
This data shows the average total payment by state and drug type. The outlier cutoff for this is choses at 95th percentile, which is 1.38X the average payments, meaning that there are 5 transactions from every 100 transactions that have potential to deviate from normal activity transactions. Therefore, there are 8266 suspicious transactions from 696 healthcare providers as display below.


Plot The Outlier

Feature 6: Median Total Payment Group by State and Drug
Find the Outliers : Potential anomalous healthcare providers
This data shows the median average total payment by state and drug type. The outlier cutoff for this is choses at 95th percentile, which is 1.47X the average payments, meaning that there are 5 transactions from every 100 transactions that have potential to deviate from normal activity transactions. Therefore, there are 8018 suspicious transactions from 696 healthcare providers as display below.


Plot the outliers

Feature 7: Average Total Discharge by State and Drug
Find the Outliers : Potential anomalous healthcare providers
This data shows the average total discharge by state and drug type. The outlier cutoff for this is chosen at 95th percentile, which is 2.29X the average total discharge, meaning that there are 5 transactions from every 100 transactions that have potential to deviate from normal activity transactions. Therefore, there are 8112 suspicious transactions from 1002 healthcare providers as display below.


Plot the outliers

Feature 8: Median Total Discharge by State and Drug
Find the Outliers : Potential anomalous healthcare providers
This data shows the median total discharge by state and drug type. The outlier cutoff for this is chosen at 95th percentile, which is 2.97X the average total discharge, meaning that there are 5 transactions from every 100 transactions that have potential to deviate from normal activity transactions. Therefore, there are 8129 suspicious transactions from 1074 healthcare providers as display below.


Plot the outliers

Feature 9 - 10: Group by State, City, and Drug
Feature 9: Median Total Payment Group by State, City, and Drug
Find the Outliers : Potential anomalous healthcare providers
This data shows the median average total payment by state, city, and drug type. The outlier cutoff for this is chosen at 95th percentile, which is 1.16X the average total payments, meaning that there are 5 transactions from every 100 transactions that have potential to deviate from normal activity transactions. Therefore, there are 8192 suspicious transactions from 530 healthcare providers as display below.


Plot the outliers

Feature 10: Median Total Discharge Group by State, City, and Drug
Find the Outliers : Potential anomalous healthcare providers
This data shows the median total discharge by state, city, and drug type. The outlier cutoff for this is chosen at 95th percentile, which is 1.55X the median total discharge, meaning that there are 5 transactions from every 100 transactions that have potential to deviate from normal activity transactions. Therefore, there are 8169 suspicious transactions from 749 healthcare providers as display below.


Plot the outliers

Section 4: Principal Component Analysis (PCA) and Histogram-based Outlier Detection (HBOS)
Principal Component Analysis (PCA)
is to reduce less important dimensions of the variables in the dataset. Let's say we have features that seem to be important; however, only taking the most significant features in the model is ideal. PCA helps in visualizing which variables weigh more important than others.
Histogram-based Outlier Detection (HBOS)
an unsupervised distance-based algorithm to capture the outliers. A suitable option for treating global outlier but not an impressive choice for local anomalies. When a data point is placed farther away from the rest of the data, then it is termed as a global outlier.
Both Unsupervised techniques
help capture outliers in the dataset, in which data analyst can further investigate those data using their business insights to find anomalous activities that deviate from normal activities.


Section 4.1: Principal Component Analysis (PCA)


Outliers
the PC7, PC8, PC9 and PC10 contribute only less than 1% variance for the overall models. Therefore, these could be identify as anomalous and need future investigations.
PC Loading
PC Loading represents the eigenvectors that each feature contribute how much weight to the corresponding principal component.

PC Loading The example contributions:
"Total_Payment_ByDRG_avg_ratio_amount" contributes 63% to PC1 as well as PC2
"Total_Discharges_ByDRG_avg_ratio_amount" contributes 77% to PC10

Conclusion
In this case, we can assume that PC7 - PC10 can contain anomalous activities. The anomalous "provider name" can be look at the features that contribute big portion in the models PC7 - PC10.
Example This example will select PC 9 - PC10 as outliers. "Total_Discharges_ByDRG_med_ratio_amount" contributes 73% to PC9
"Total_Discharges_ByDRG_avg_ratio_amount" contributes 77% to PC10 Therefore, these two features can explain the anomalous providers. The reasons that total inpatient discharge can be anomalous is because some healthcare providers might have them stay in the hospital per symptom more than in general.

Healthcare Providers with anomalous activities for further investigations


Section 4.2: Histogram-based Outlier Detection (HBOS)
Download and install packages

Read the columns

Split train and test sets

Normalize the dataset

import HBOs


Method 1: Average
Plot the histogram to set the outlier point

Set the outlier score

Separate dataset into two clusters

Conclusion
The average anomaly score in Cluster 1 is much higher than that of Cluster 0, -0.37 and 1.47 respectively. The summary statistics also show dramatic differences between the two clusters. Therefore, there might be anomalous activities in cluster 1. Cluster 1, 9,840 data points, deserves further investigations.
Method 2: The Maximum of Maximum (MOM)

Set the outlier score

Separate dataset into two clusters

Conclusion
The average anomaly score in Cluster 1 is much higher than that of Cluster 0, -0.37 and 1.47 respectively. The summary statistics also show dramatic differences between the two clusters. Therefore, there might be anomalous activities in cluster 1. Cluster 1, 9,840 data points, deserves further investigations.
Method 3: The Average of Maximum (AOM)
Plot the histogram to set the outlier point

Set the outlier score

Separate dataset into two clusters

Conclusion
The average anomaly score in Cluster 1 is much higher than that of Cluster 0, 1.57 to -0.26 respectively. The summary statistics also show dramatic differences between the two clusters. Therefore, there might be anomalous activities in cluster 1. Cluster 1, 13702 data points, deserves further investigations.
Method 4: The maximum of average (MOA)
Plot the histogram to set the outlier point

Set the outlier score

Separate dataset into two clusters

Conclusion
The average anomaly score in Cluster 1 is much higher than that of Cluster 0, 1.69 to -0.25 respectively. The summary statistics also show dramatic differences between the two clusters. Therefore, there might be anomalous activities in cluster 1. Cluster 1 deserves further investigations.


Comments